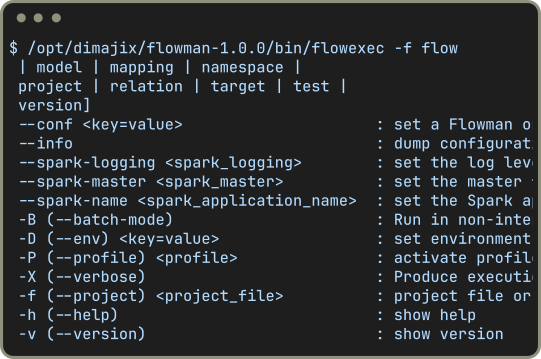
Use Flowmans powerful CLI tools without requiring extensive support from developers. Get into control both for recurring jobs but also in case of any incident by easily executing only specific parts of any project.

Use Flowmans powerful CLI tools without requiring extensive support from developers. Get into control both for recurring jobs but also in case of any incident by easily executing only specific parts of any project.
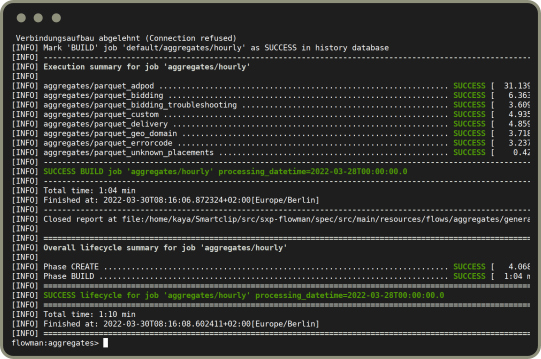
Focus on important events provided by the clean console output of Flowman, like the execution of each target. Immediately understand where and why a job fails.

Focus on important events provided by the clean console output of Flowman, like the execution of each target. Immediately understand where and why a job fails.
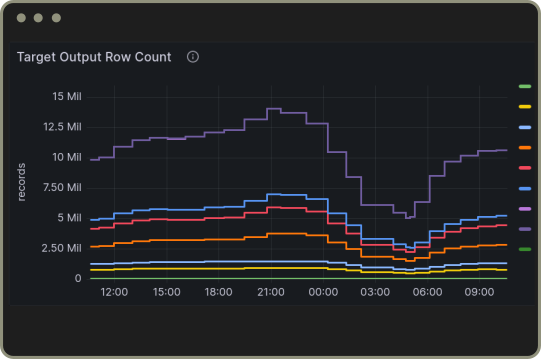
Get detailed insights and detect anomalies early by inspecting execution metrics provided by Flowman, like the number of records written per output or the execution time. Store all metrics either in a relational database or push them to Prometheus for advanced monitoring.

Get detailed insights and detect anomalies early by inspecting execution metrics provided by Flowman, like the number of records written per output or the execution time. Store all metrics either in a relational database or push them to Prometheus for advanced monitoring.
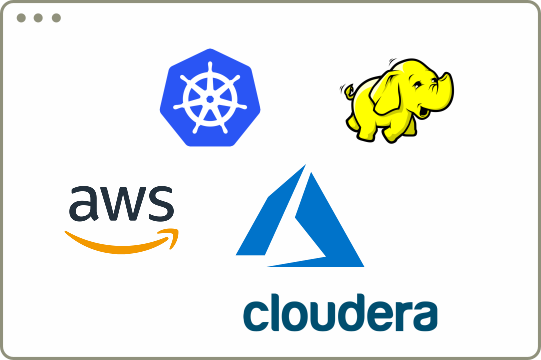
Deploy Flowman with your existing infrastructure, like Hadoop, Kubernetes, Cloudera CDP, AWS EMR and Azure Synapse. Flowman does not introduce new complex dependencies, but integrates with your existing platform.

Deploy Flowman with your existing infrastructure, like Hadoop, Kubernetes, Cloudera CDP, AWS EMR and Azure Synapse. Flowman does not introduce new complex dependencies, but integrates with your existing platform.